
Contributions
- UX Design ( Lead )
- Design Management ( 1 report )
- Project Management ( Interim - 5 reports )
- Interviews/Knowledge Elicitation ( Writing and Facilitation )
- Qualitative Analysis
- Work Domain Analysis & Abstraction
- Representation Design
- Design Specification Writing

The GeoHAI application is comprised of 3 primary frames: Timeline View (left), Map View (center), and Patient/Room Histories (bottom).
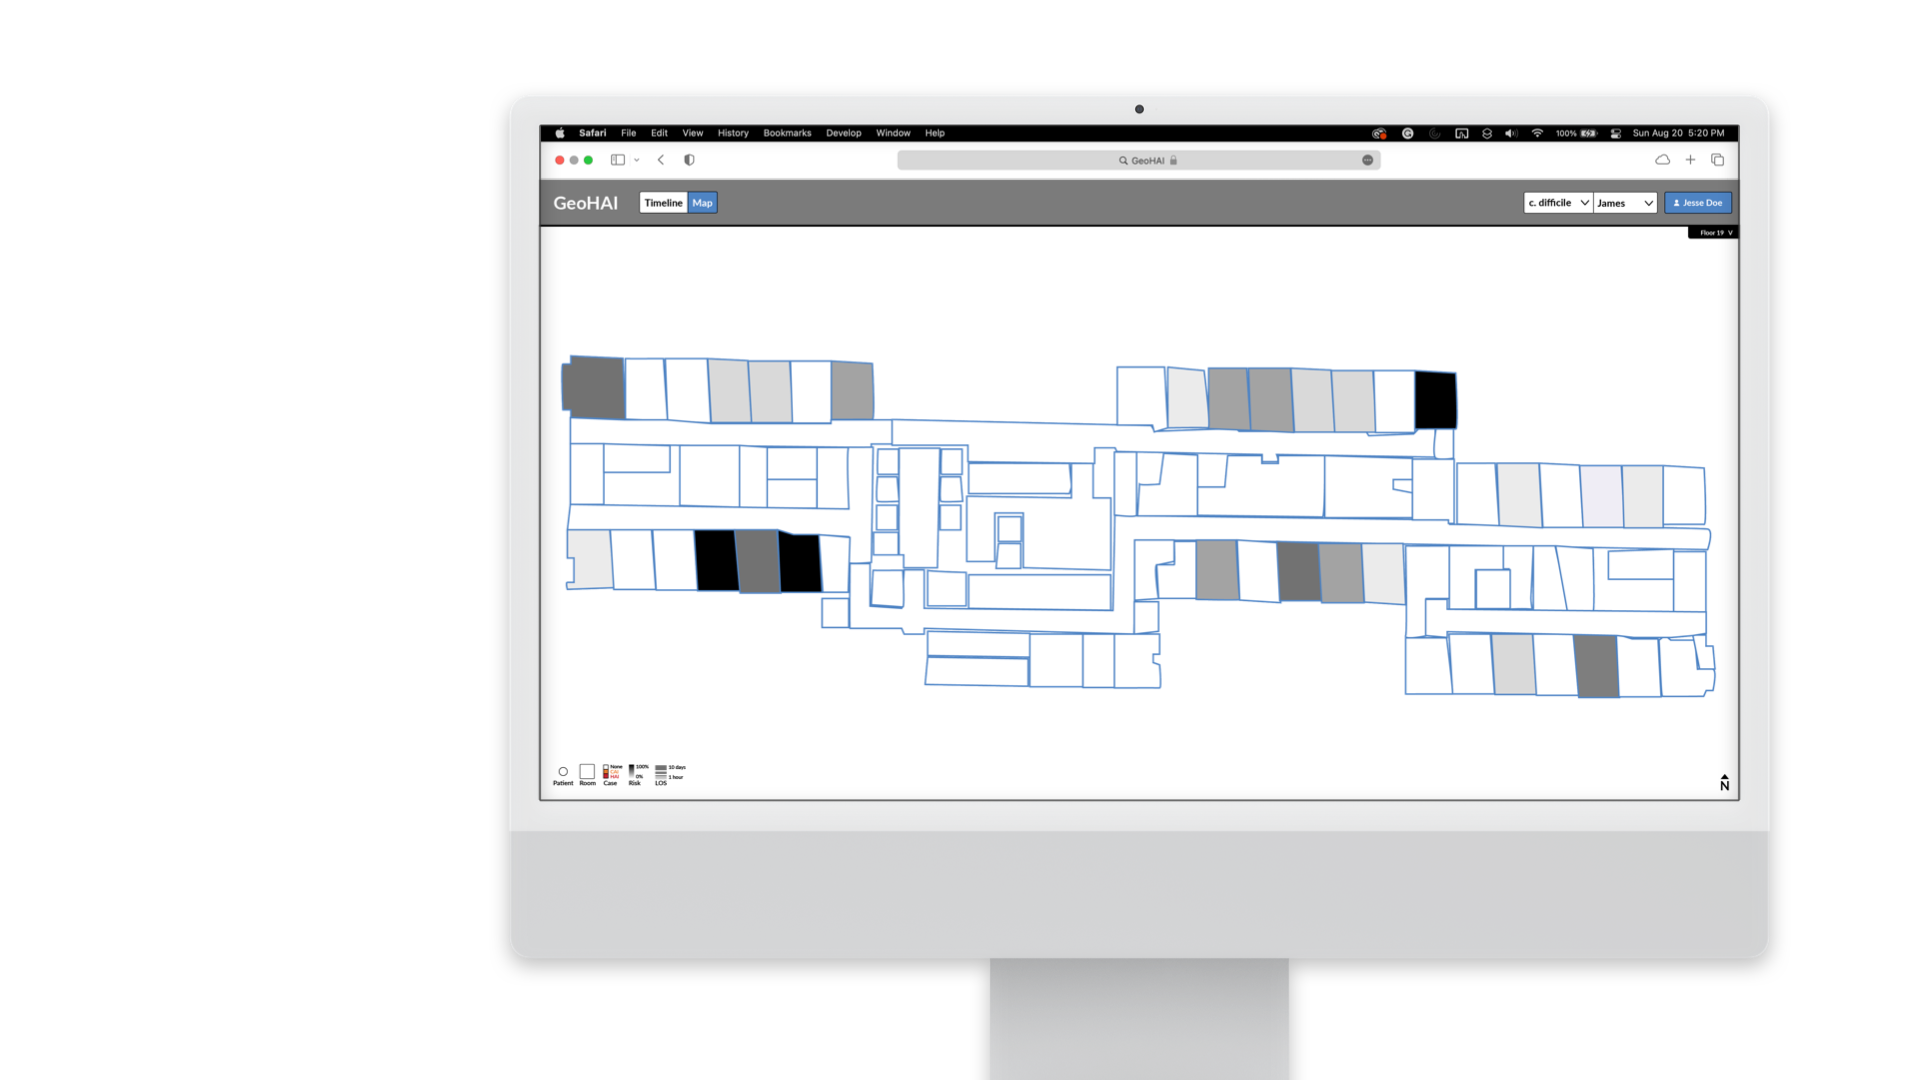
We were initially handed a sketch of the above design to simply re-skin. A model determined a relative value for the risk of each room, and this was mapped to a saturation value.
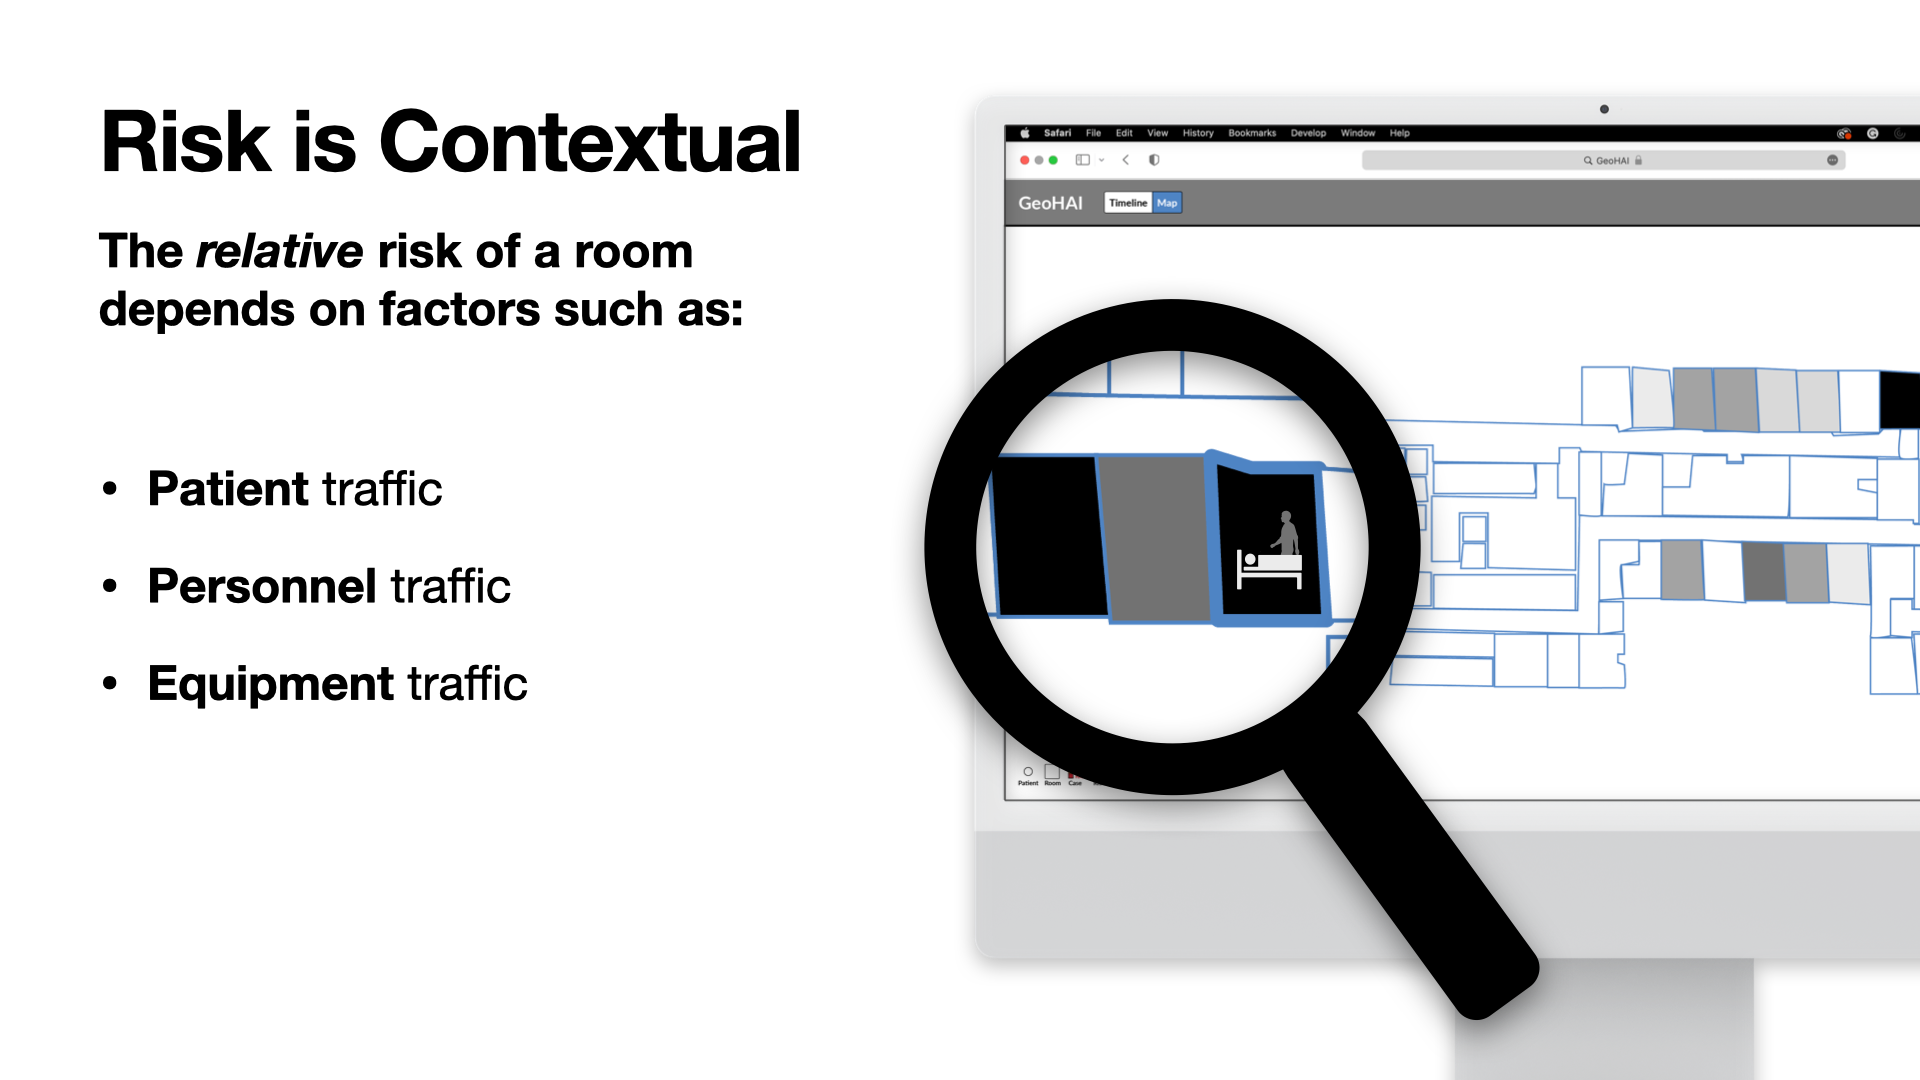
This single score masked a large amount of useful data that informed the score, such as the movement of patients, personnel, and equipment between rooms (paths of travel for infections transmitted by shared surfaces).
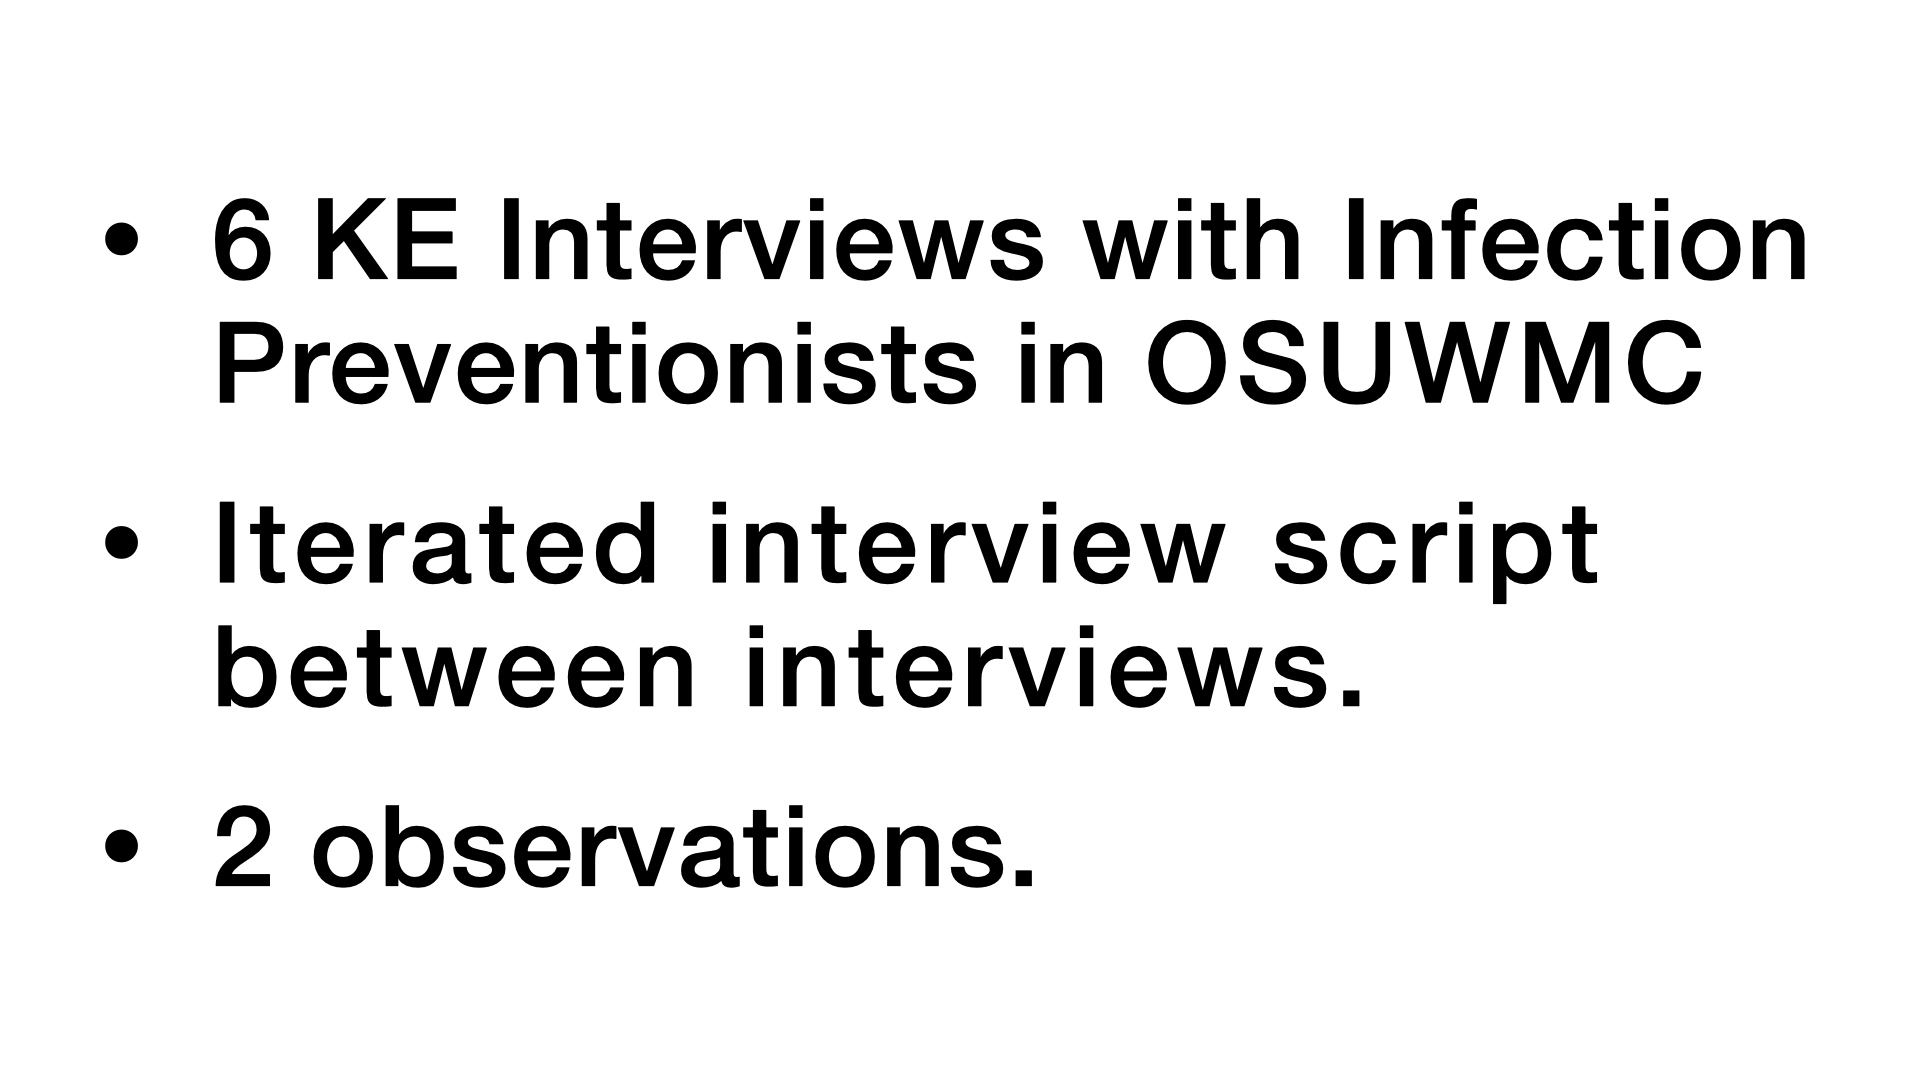
We conducted knowledge-elicitation interviews and observations in Ohio State's university hospital (OSUWMC). Our script was iterated across sessions as interviews led to more questions or revealed discrepancies across units.
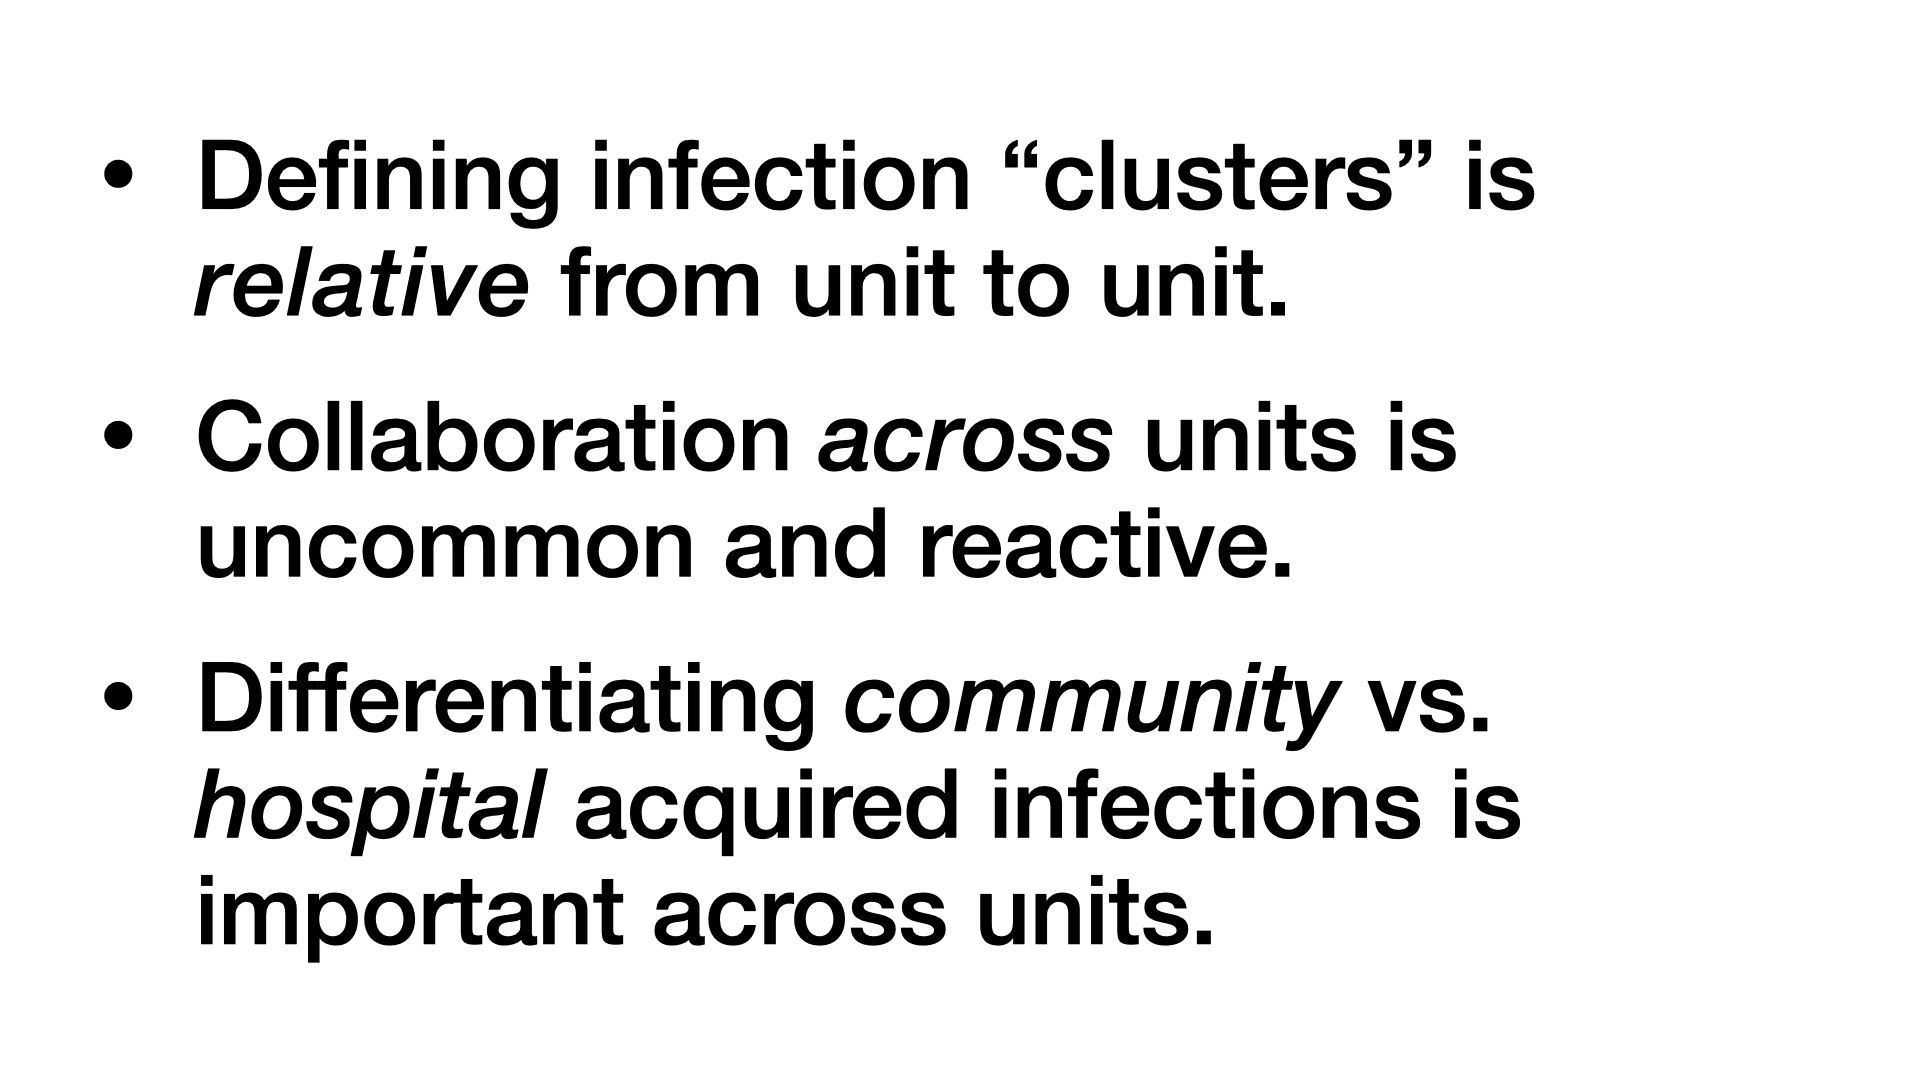
We found the definition of infection “clusters”—the term for a group of related cases—differed from unit to unit, current tooling did not provide shared perspectives across units, and differentiating CAI/HAI was a vital reference for the work context, despite its insignificance to the risk of infection transmission.
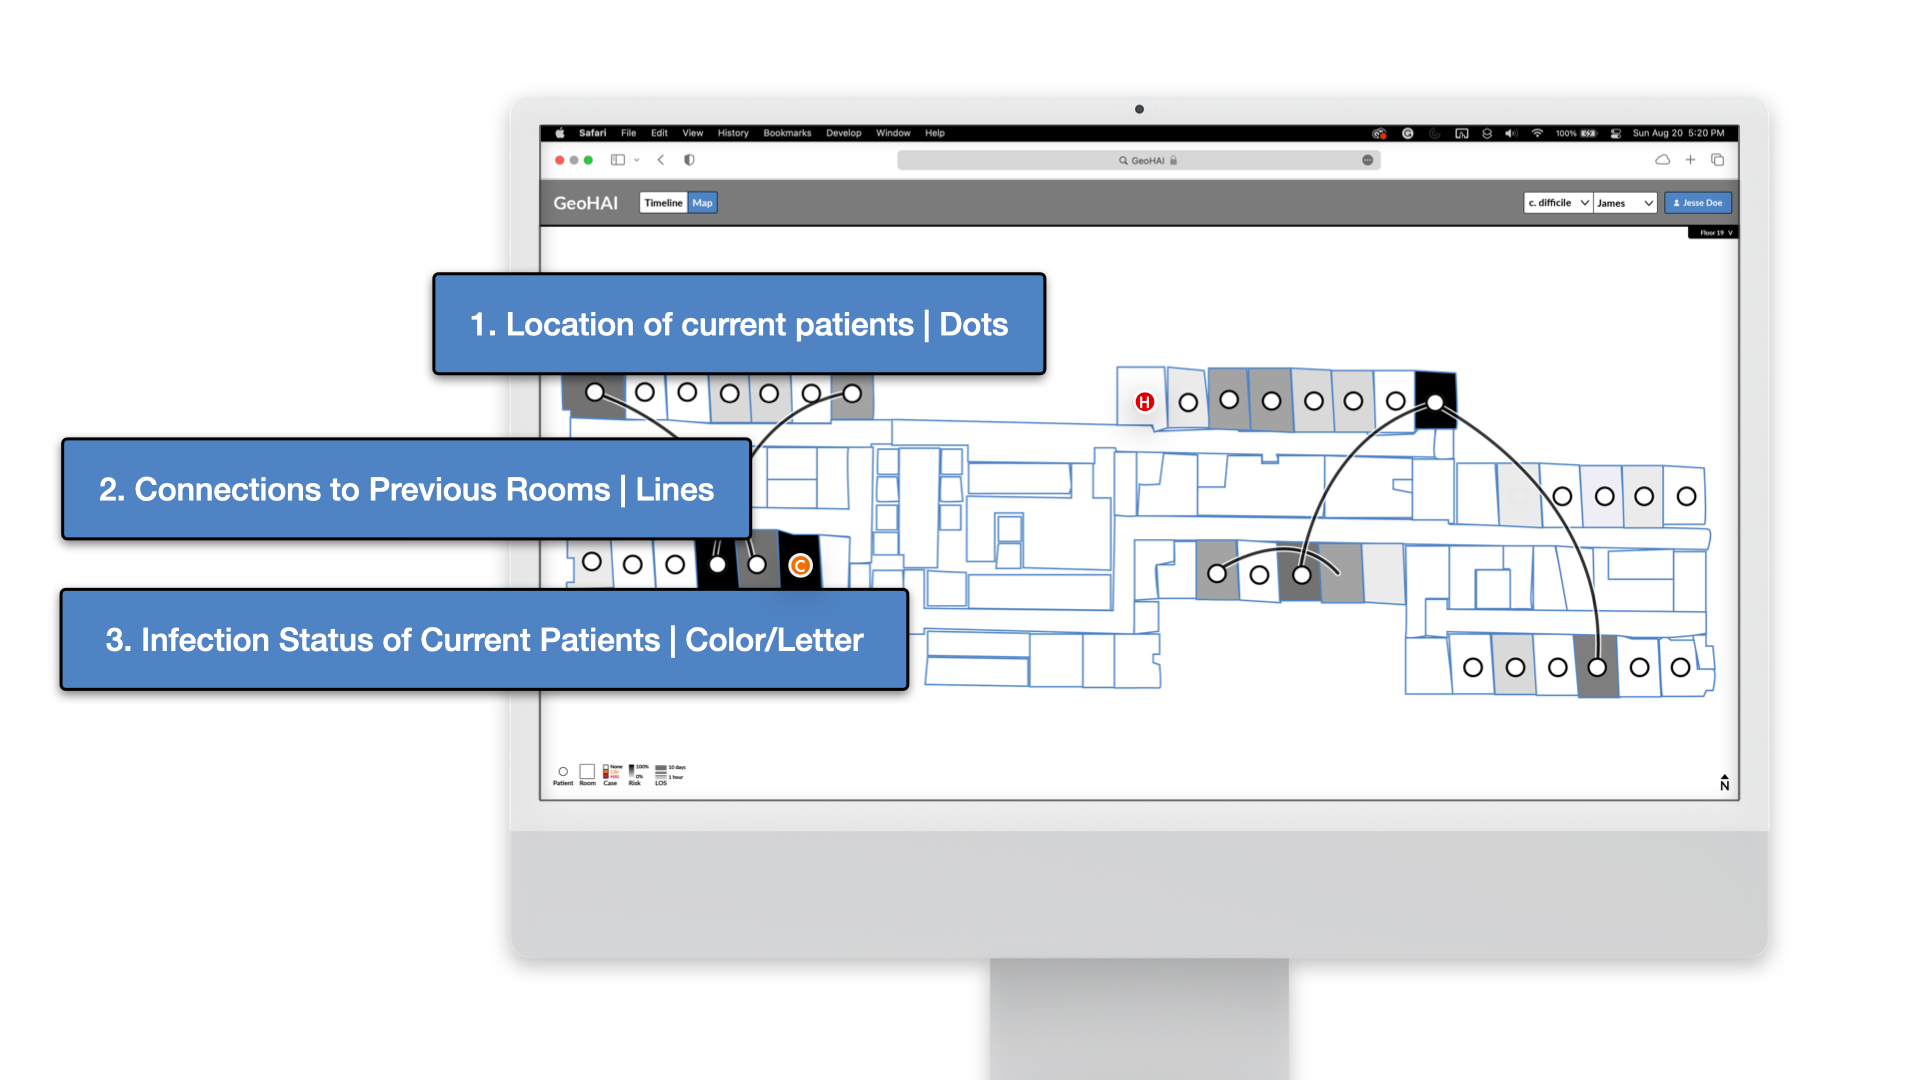
To provide context behind the model's score, we provided the location of current patients (represented as dots), connections these patients shared to previous rooms (lines), and the infection status of current patients (color coded). The infection status dots were also marked with a corresponding letter for color accessibility.
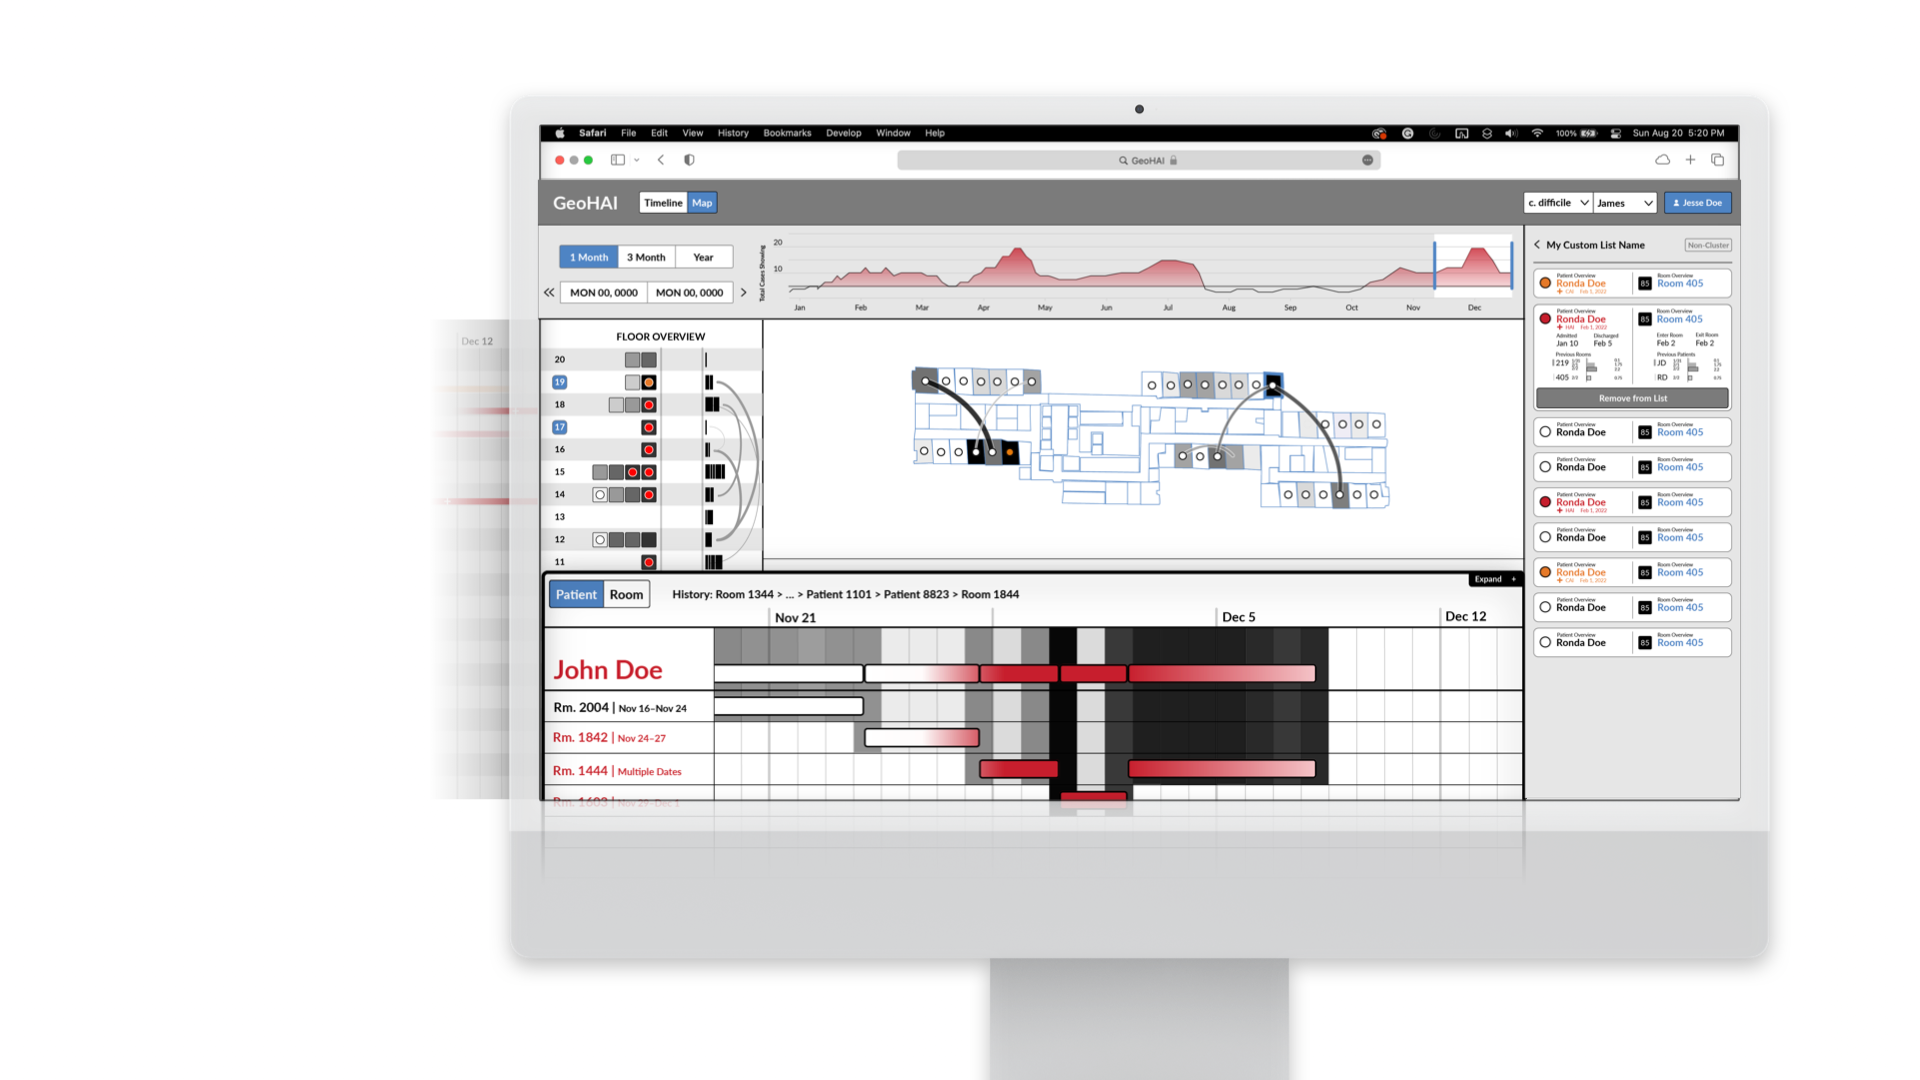
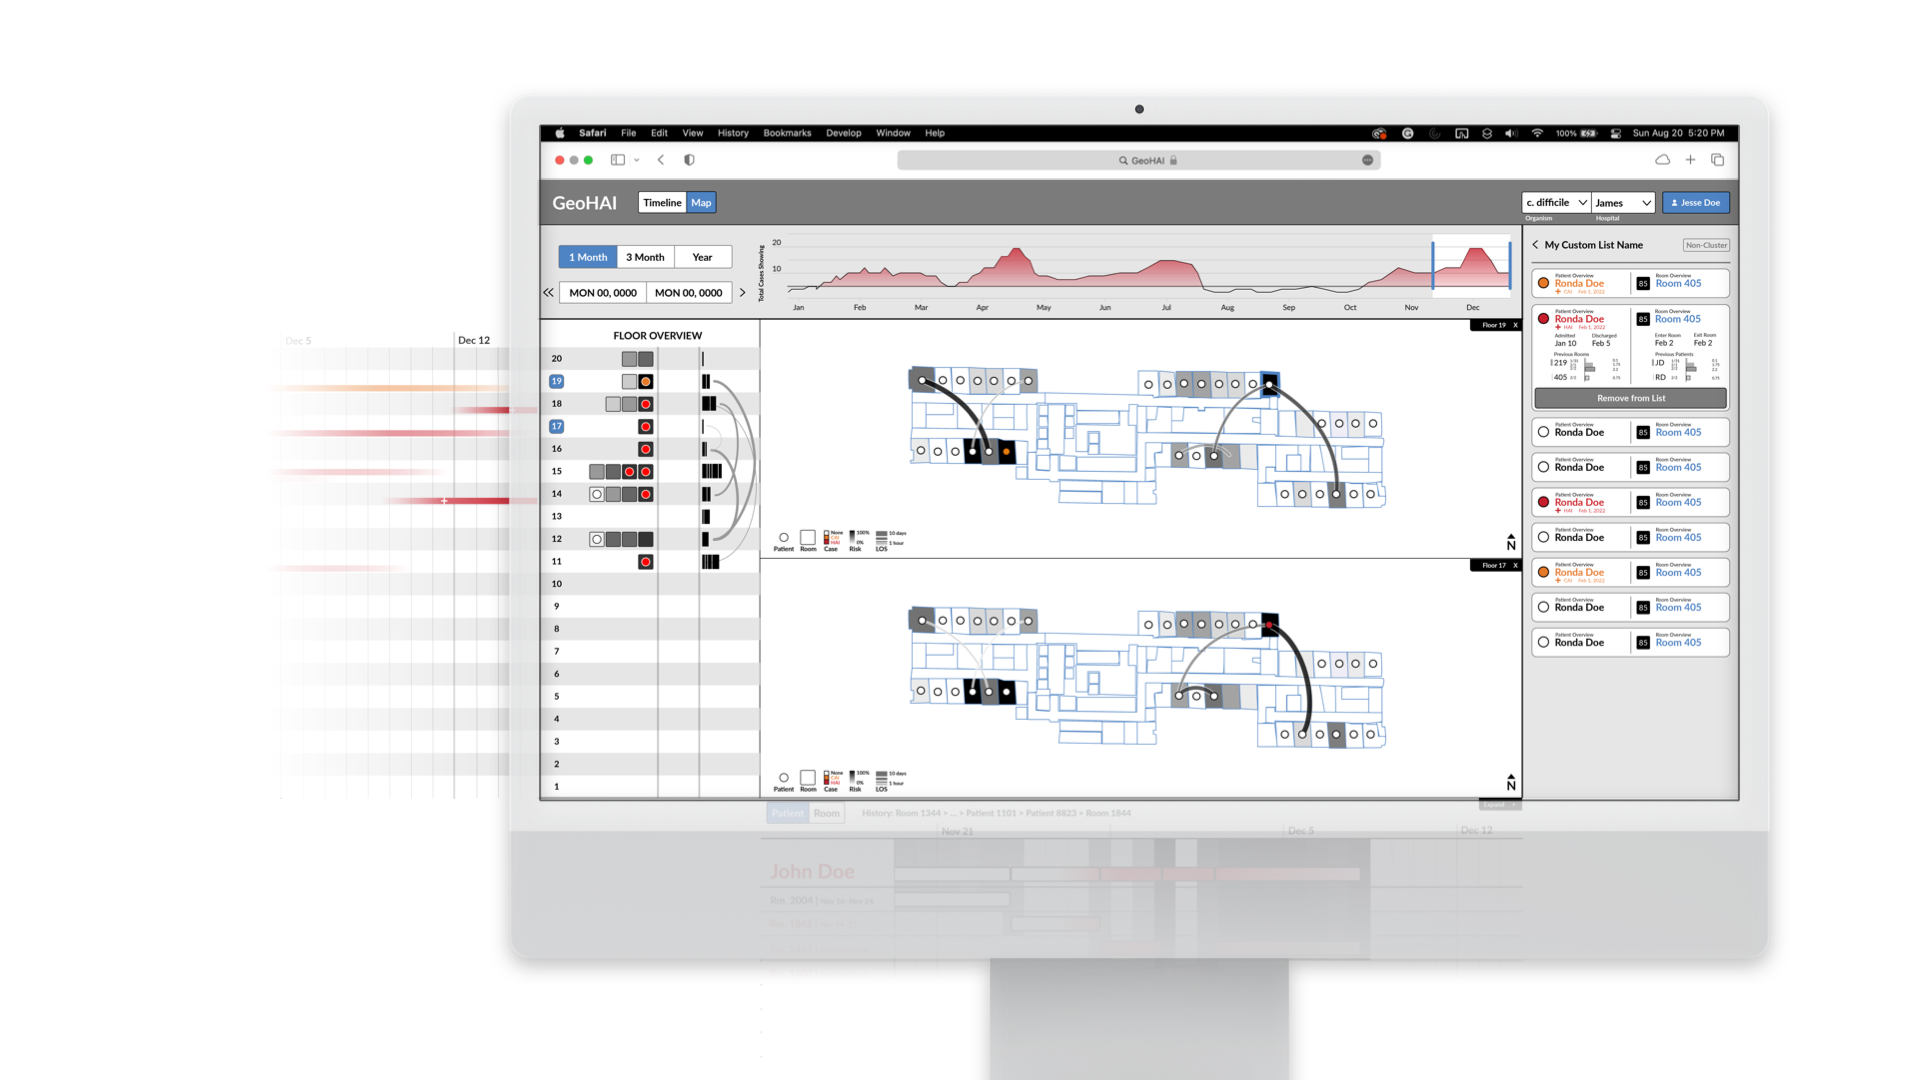
As we built out full functionality for the application, we were able to use the existing data to provide features that further contextualized practitioners' work in relationship to one another. Infections across the hospital, connections between floors, and time histories of patients and rooms were incorporated into these features.
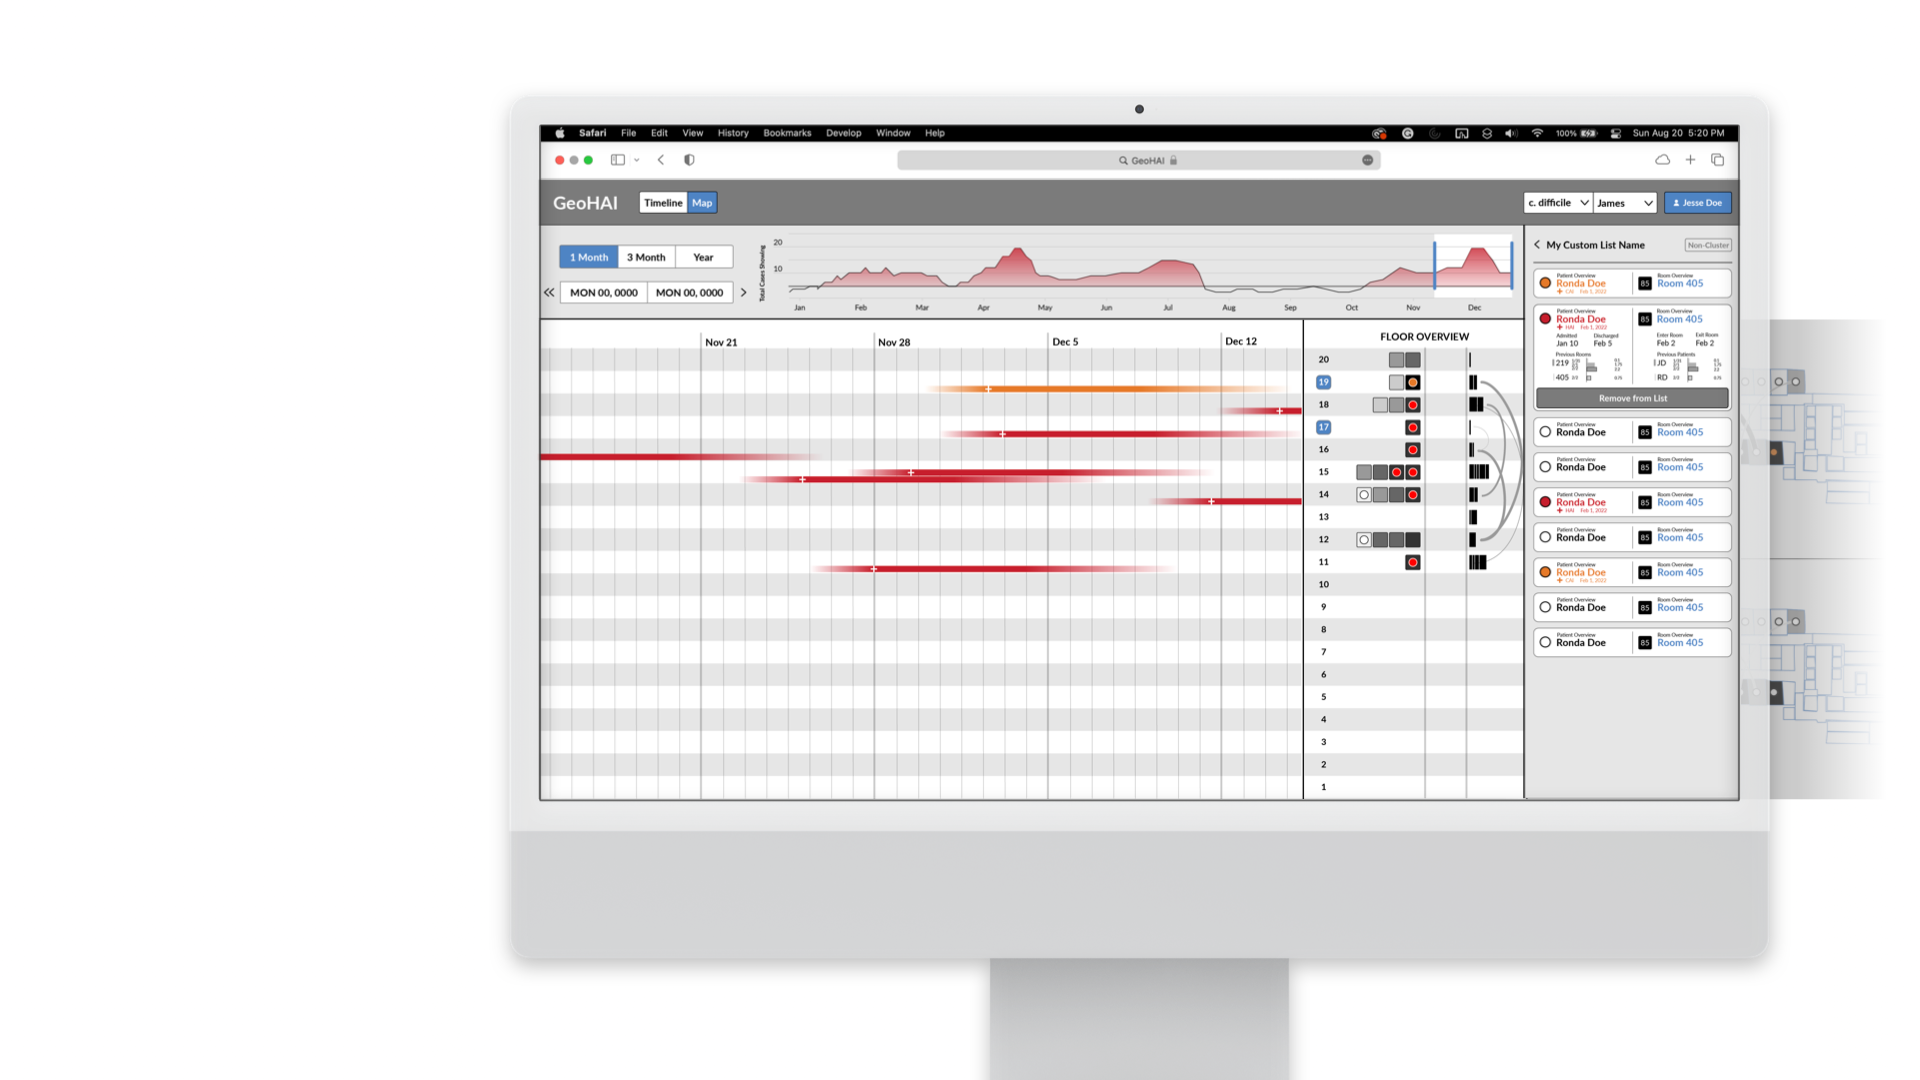
By clearly communicating the importance of contextualizing the model's outputs, we received buy-in to include a full feature dedicated to temporal proximity across cases, complementing the client's requirement of displaying geographic data. This provided a shared display that individual practitioners could reference to understand their work in relation to activity across the whole hospital over time.
Our design decisions demonstrate that a conveying the full complexity of a problem does not have to be inelegant. When we couple Cognitive Systems Engineering heuristics with standard UI/UX HCD practices, we move toward designs that are usable, desirable, and situated to the work context beyond the computer. These displays allow us to leverage the full potential of our data and models. With tools like these, practitioners can work with AI/ML agents as teammates rather than magic 8 balls.
AI/ML interfaces that afford Observability, Predictability, and Directability enable our users to leverage the full potential of their expertise and their data.